Table of Contents
2024 Developer Fee Justification Study
Pioneer Union Elementary School District
Mr. Paul Van Loon, Superintendent
Prepared by
Schoolworks, Inc.
8700 Auburn Folsom Rd., #200
Granite Bay, Ca 95746
(916) 733-0402
www.schoolworksgis.com
Executive Summary
This Developer Fee Justification Study demonstrates that the Pioneer Union Elementary School District requires its share of the full statutory impact fee to accommodate impacts from development activity.
A fee of $4.79 per square foot for residential construction and a fee of $0.78 per square foot for commercial/industrial construction is currently assessed on applicable permits pulled in the District. The new fee amounts are $5.17 per square foot for residential construction and $0.84* per square foot for commercial/industrial construction. This proposed increase represents $0.38 per square foot and $0.06 per square foot for residential and commercial/industrial construction, respectively. The District’s share of the developer fees is 60%.
The following table shows the impacts of the new fee amounts:
| Totals | Previous | New | Change |
| Residential | $4.79 | $5.17 | $0.38 |
| Commercial/Ind. | $0.78 | $0.84 | $0.06 |
| District Share: | 60.00% |
| Net Impact | Previous | New | Change |
| Residential | $2.87 | $3.10 | $0.23 |
| Commercial/Ind. | $0.47 | $0.50 | $0.03 |
The total projected number of housing units to be built over the next five years is 485. The average area per unit is 1,934 square feet. This Study demonstrates a need of $6.20 per square foot for residential construction.
Background
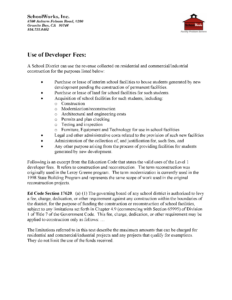
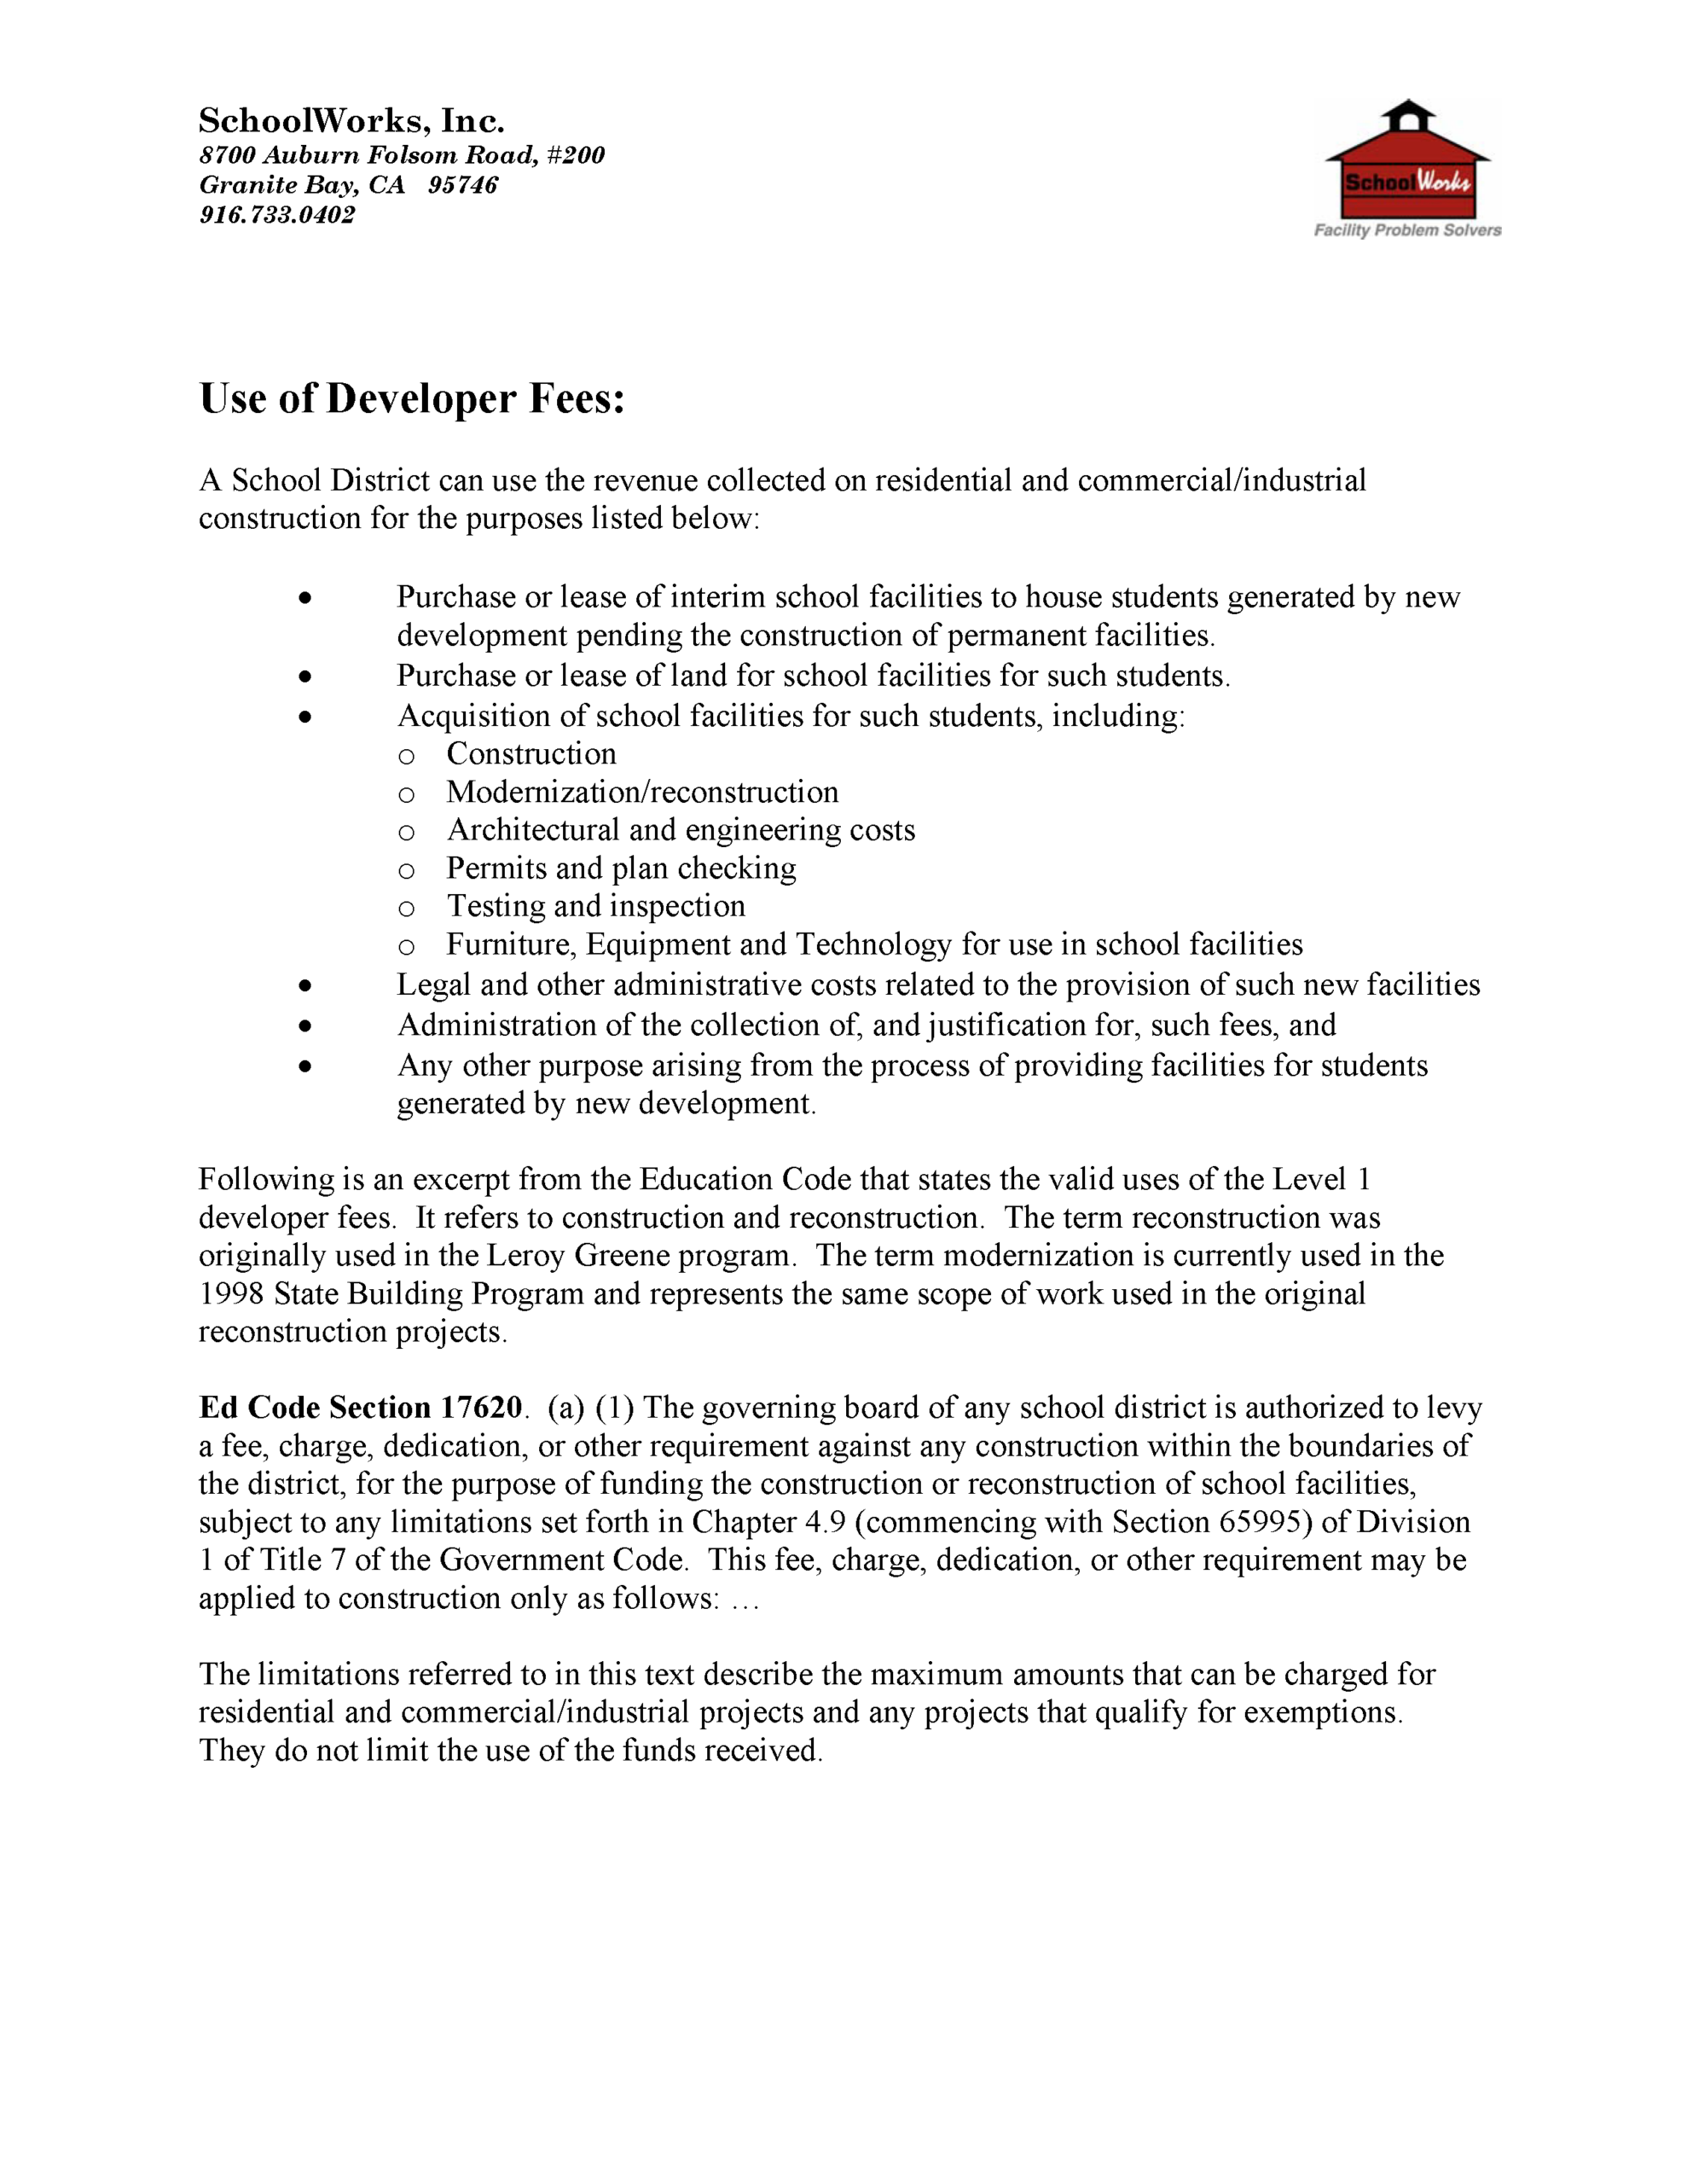
Education Code Section 17620 allows school districts to assess fees on new residential and commercial construction within their respective boundaries. These fees can be collected without special city or county approval, to fund the construction of new school facilities necessitated by the impact of residential and commercial development activity. In addition, these fees can also be used to fund the reconstruction of school facilities to accommodate students generated from new development projects. Fees are collected immediately prior to the time of the issuance of a building permit by the City or the County.
As new development generates students, additional school facilities or modernization of existing facilities will be needed to house the new students. Because of the high cost associated with constructing school facilities and the District’s limited budget, outside funding sources are required for future school construction. State and local funding sources for the construction and/or reconstruction of school facilities are limited.
The authority sited in Education Code Section 17620 states in part “… the governing board of any school district is authorized to levy a fee, charge, dedication or other form of requirement against any development project for the construction or reconstruction of school facilities.” The legislation originally established the maximum fee rates at $1.50 per square foot for residential construction and $0.25 per square foot for commercial/industrial construction. Government Code Section 65995 provides for an inflationary increase in the fees every two years based on the changes in the Class B construction index. As a result of these adjustments, the fees authorized by Education Code 17620 are currently $5.17 per square foot of residential construction and $0.84 per square foot of commercial or industrial construction.
Purpose and Intent
Prior to levying developer fees, a district must demonstrate and document that a reasonable relationship exists between the need for new or reconstructed school facilities and residential, commercial and industrial development. The justification for levying fees is required to address three basic links between the need for facilities and new development. These links or nexus are:
Burden Nexus: A district must identify the number of students anticipated to be generated by residential, commercial and industrial development. In addition, the district shall identify the school facility and cost impact of these students.
Cost Nexus: A district must demonstrate that the fees to be collected from residential, commercial and industrial development will not exceed the cost of providing school facilities for the students to be generated from the development.
Benefit Nexus: A district must show that the construction or reconstruction of school facilities to be funded by the collection of developer fees will benefit the students generated by residential, commercial and industrial development.
The purpose of this Study is to document if a reasonable relationship exists between residential, commercial and industrial development and the need for new and/or modernized facilities in the Pioneer Union Elementary School District.
Following in this Study will be figures indicating the current enrollment and the projected development occurring within the attendance boundaries of the Pioneer Union Elementary School District. The students generated will then be loaded into existing facilities to the extent of available space. Thereafter, the needed facilities will be determined and an estimated cost will be assigned. The cost of the facilities will then be compared to the area of residential, commercial and industrial development to determine the amount of developer fees justified.
Enrollment and Impacts
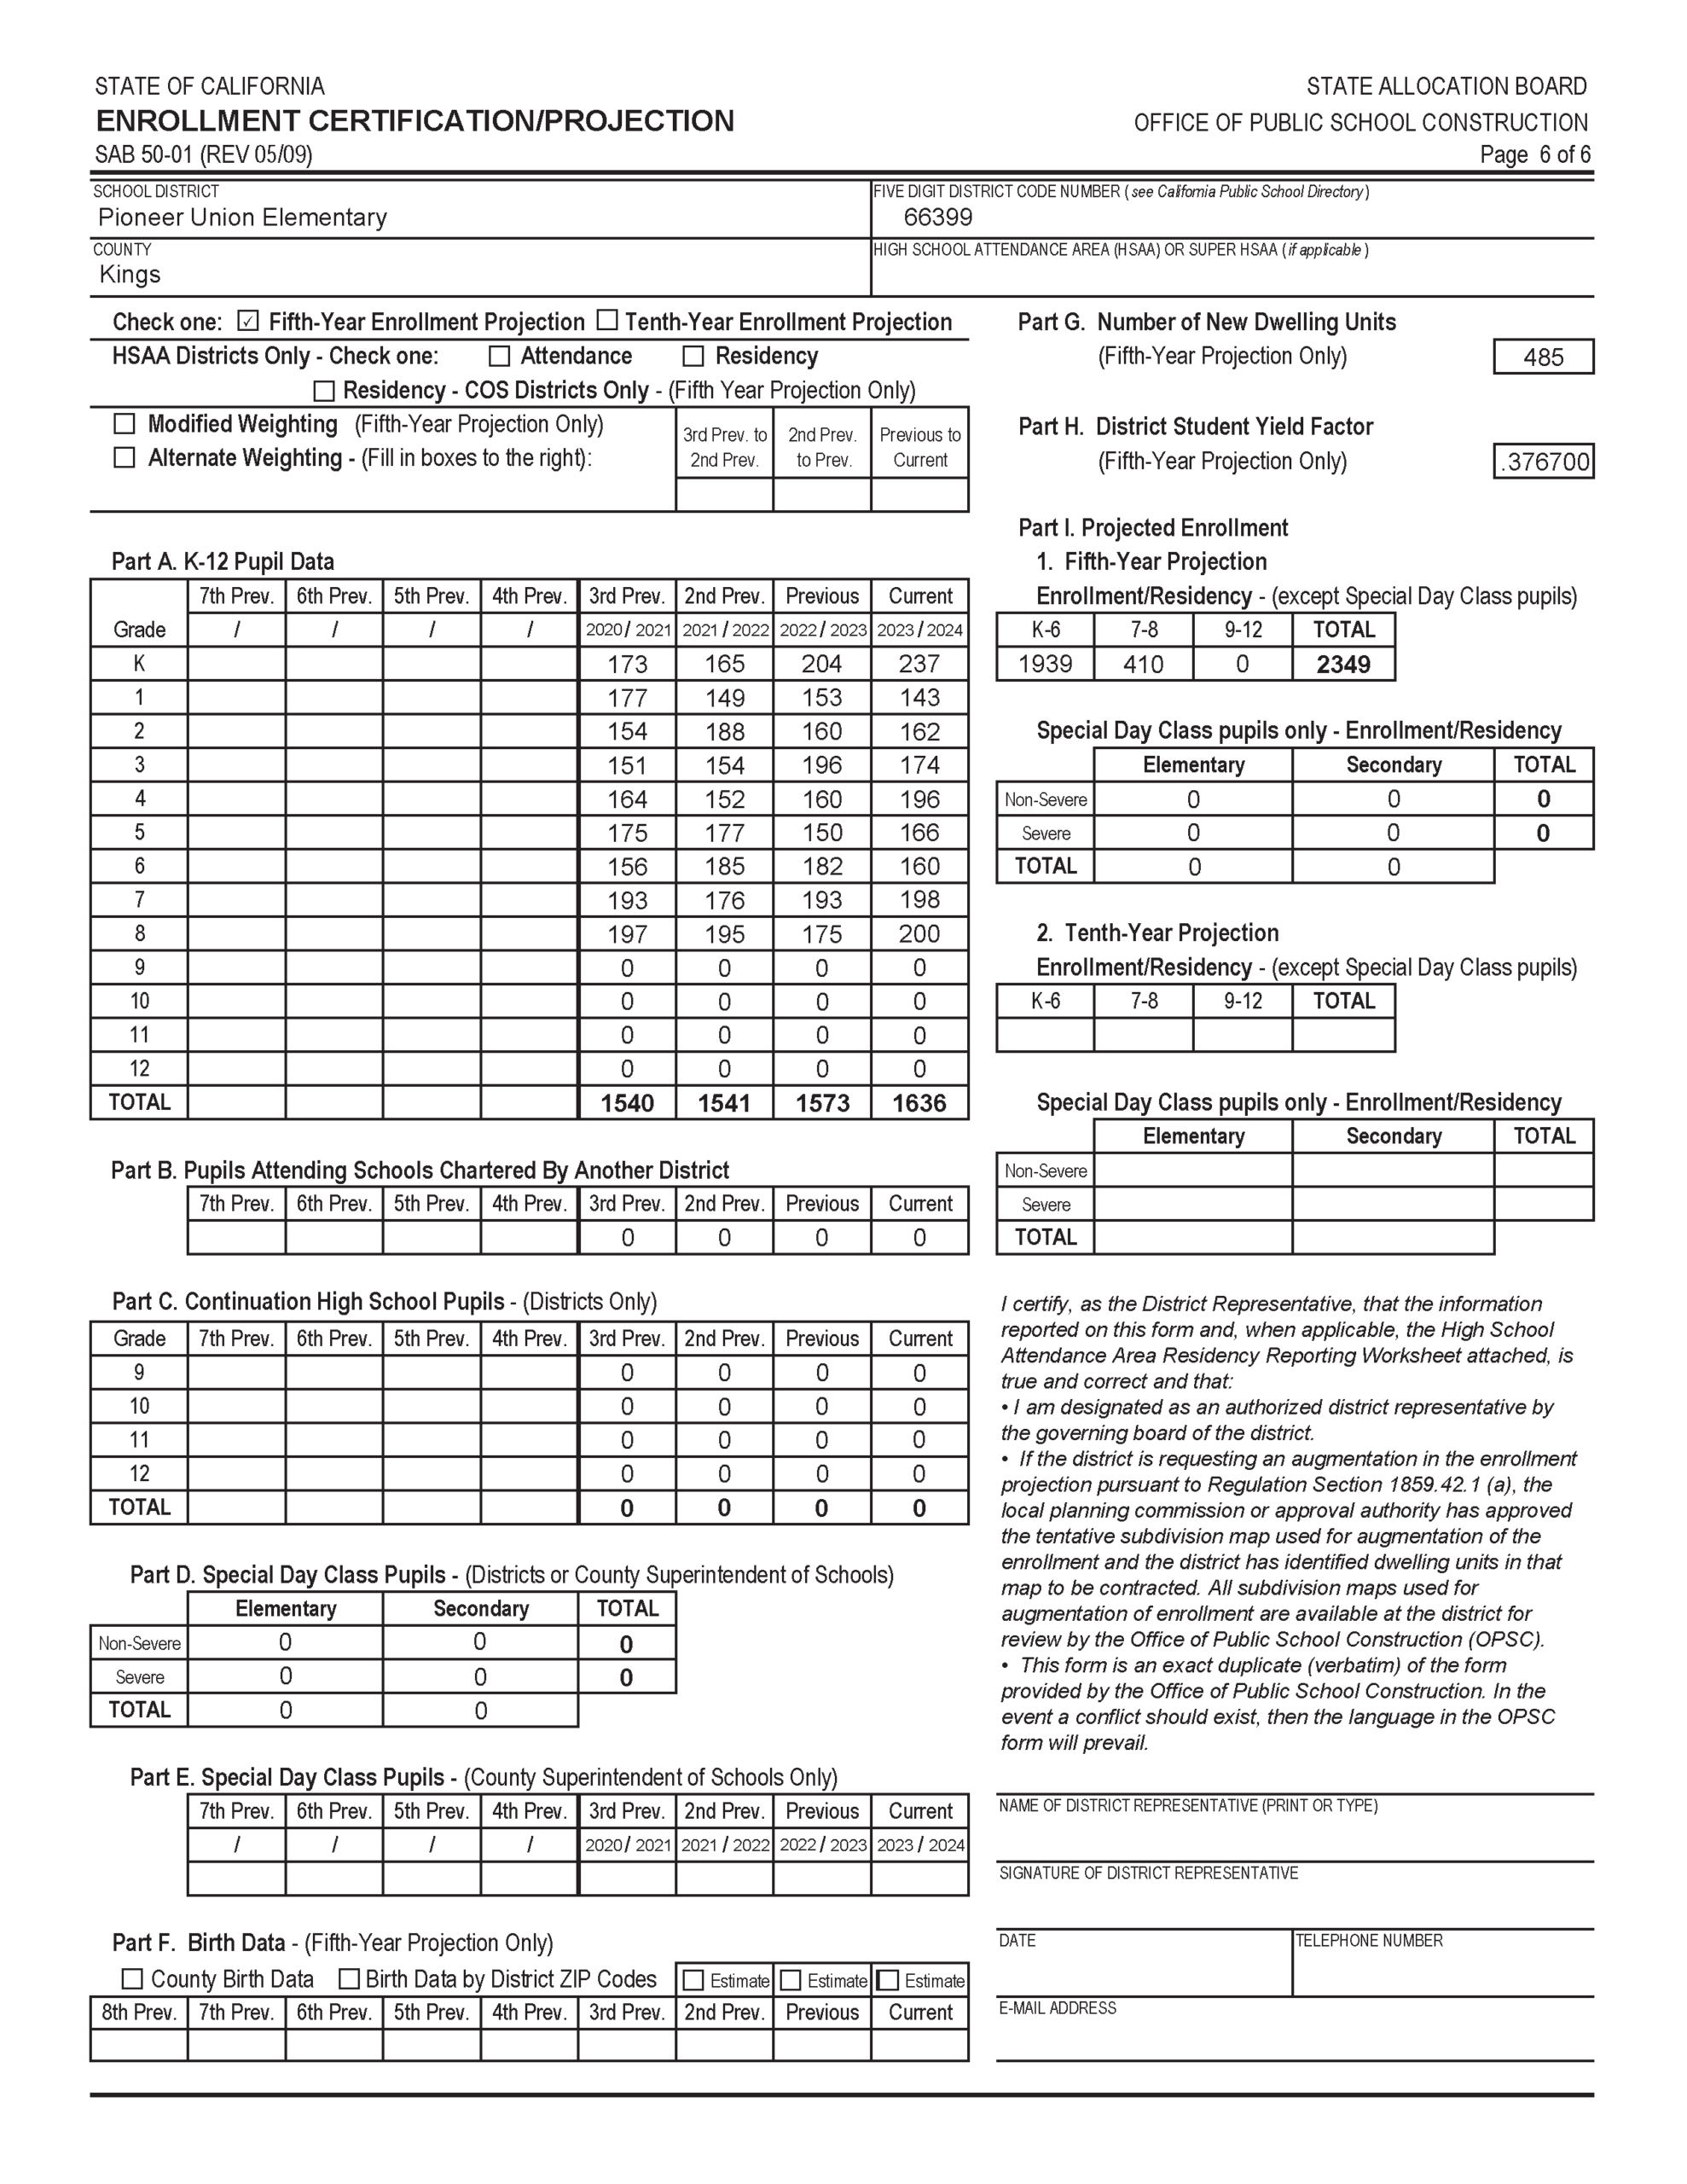
In 2023/2024 the District’s total enrollment (CBEDS) was 1,636 students. The enrollment by grade level is shown here in Table 2.
| Grade | 2023/2024 |
| TK/K | 237 |
| 1 | 143 |
| 2 | 162 |
| 3 | 174 |
| 4 | 196 |
| 5 | 166 |
| 6 | 160 |
| TK-6 Total | 1,238 |
| 7 | 198 |
| 8 | 200 |
| 7-8 Total | 398 |
| TK-8 Total | 1,636 |
Student Generation Factor
In determining the impact of new development, the District is required to show how many students will be generated from the new developments. In order to ensure that new development is paying only for the impact of those students that are being generated by new homes and businesses, the student generation factor is applied to the number of new housing units to determine development-related impacts.
The student generation factor identifies the number of students per housing unit and provides a link between residential construction projects and projections of enrollment. The State-wide factor used by the Office of Public School Construction is 0.50 for grades TK-8. For the purposes of this Study we will use the local factors to determine the students generated from new housing developments. This was done by comparing the number of housing units in the school district to the number of students in the school district as of the 2020 Census. Table 3 shows the student generation factors for the various grade groupings.
| Grades | Students per Household |
| TK-6 | 0.28814 |
| 7-8 | 0.08857 |
| Total | 0.3767 |
New Residential Development Impacts
The Pioneer Union Elementary School District has experienced an average new residential construction rate of approximately 241 units per year over the past four years. This was determined by reviewing the residential permits pulled and school development impact fees paid to the District. After contacting the city planning department within the school district boundaries, it was determined that the residential construction rate over the next five years will average 97 units per year. Projecting the average rate forward, we would expect that 485 units of residential housing will be built within the District boundaries over the next five years.
To determine the impact of residential development, a student projection is done. Applying the student generation factor of 0.3767 to the projected 485 units of residential housing, we expect that 183 students will be generated from the new residential construction over the next five years. This includes 140 elementary school students and 43 middle school students.
The following table shows the projected impact of new development. The students generated by development will be utilized to determine the facility cost impacts to the school district.
| Grades | Generation Rate | Students Generated |
| TK to 6 | 0.2881 | 140 |
| 7 to 8 | 0.0886 | 43 |
| Totals | 0.3767 | 183 |
Existing Facility Capacity
To determine the need for additional school facilities, the capacity of the existing facilities must be identified and compared to current and anticipated enrollments. The District’s existing building capacity will be calculated using the State classroom loading standards shown in Table 6. The following types of “support-spaces” necessary for the conduct of the District’s comprehensive educational program, are not included as “teaching stations,” commonly known as “classrooms” to the public:
| List of Core and Support Facilities |
| Library |
| Multipurpose Room |
| Office Area |
| Staff Workroom |
| Resource Specialist |
| Gymnasium |
| Lunch Room |
| P.E. Facilities |
Classroom Loading Standards
The following maximum classroom loading-factors are used to determine teaching-station “capacity,” in accordance with the State legislation and the State School Building Program. These capacity calculations are also used in preparing and filing the baseline school capacity statement with the Office of Public School Construction.
| Grade Level | Students/Classroom |
| TK/Kindergarten | 25 |
| 1st-3rd Grades | 25 |
| 4th-6th Grades | 25 |
| 7th-8th Grades | 27 |
| Non Severe Special Ed | 13 |
Existing Facility Capacity
The State determines the baseline capacity by either loading all permanent teaching stations plus a maximum number of portables equal to 25% of the number of permanent classrooms or by loading all permanent classrooms and only portables that are owned or have been leased for over 5 years. As allowed by law and required by the State, facility capacities are calculated by identifying the number of teaching stations at each campus. All qualified teaching stations were included in the calculation of the capacities at the time the initial inventory was calculated. To account for activity and changes since the baseline was established in 1998/99, the student grants (which represent the seats added either by new schools or additions to existing schools) for new construction projects funded by OPSC have been added. Using these guidelines the District’s current State calculated capacity is shown in Table 7.
| School Facility | Permanent Classrooms | Portable Classrooms | Chargeable Portables | Total Chargeable Classrooms | State Loading Factor | State Funded Projects | Total State Capacity |
| Grades TK-6 | 9 | 37 | 10 | 19 | 25 | 754 | 1,229 |
| Grades 7-8 | 28 | 0 | 0 | 28 | 27 | 56 | 812 |
| Totals | 37 | 37 | 10 | 47 | 832 | 2,063 |
OPSC Funded Projects
| Name | Project # | Tk-6 Grants | 7-8 Grants | Special Ed |
| Frontier Elem | 2 | 579 | 45 | 13 |
| Pioneer Elem | 3 | 175 | 11 | 9 |
| Totals | 754 | 56 | 22 |
This table shows a basic summary of the form and procedures used by OPSC (Office of Public School Construction) to determine the capacity of a school district. There were a total of 37 permanent classrooms in the District when the baseline was established. In addition there were 37 portable classrooms. However, OPSC regulations state that if the number of portables exceeds 25% of the permanent classrooms, then the maximum number of portables to be counted in the baseline capacity is 25% of the permanent classrooms. Therefore the chart shows the chargeable portables as 10 which is 25% of the permanent classroom count. This results in a total classroom count of 47 and is referred to as the chargeable classrooms since it accounts for the fact that some of the portable were not included in the total. This is done to account for the fact that portables are typically considered to be temporary, especially when the total number exceeds 25% of the permanent classrooms.
To determine the total capacity based on State standards, the capacity of the chargeable classrooms are multiplied by the State loading standards and then the capacity of the projects completed since 1998/99 (when the baseline was established) are added based on the State funded new construction projects. As Table 7 shows, the total State capacity of the District facilities is 2,063 students.
Unhoused Students by State Housing Standards
This next table compares the facility capacity with the space needed to determine if there is available space for new students from the projected developments. The space needed was determined by reviewing the historic enrollments over the past four years along with the projected enrollment in five years to determine the number of seats needed to house the students within the existing homes. The seats needed were determined individually for each grade grouping. The projected enrollment in the space needed analysis did not include the impact of any new housing units.
| School Facility | State Capacity | Space Needed | Available Capacity |
| Grades TK-6 | 1,229 | 1,780 | (551) |
| Grades 7-8 | 812 | 394 | 418 |
| Special Ed | 22 | 23 | (1) |
| Totals | 2,063 | 2,197 | (134) |
Calculation of Development’s Fiscal Impact on Schools
This section of the Study will demonstrate that a reasonable relationship exists between residential, commercial/industrial development and the need for school facilities in the Pioneer Union Elementary School District. To the extent this relationship exists, the District is justified in levying developer fees as authorized by Education Code Section 17620.
School Facility Construction Costs
For the purposes of estimating the cost of building school facilities we have used the State School Building Program funding allowances. These amounts are shown in Table 9. In addition to the basic construction costs, there are site acquisition costs of $61,474 per acre and service-site, utilities, off-site and general site development costs which are also shown in Table 9.
| Grade | Base Grant | Fire Alarms | Fire Sprinklers | Per Student Total |
| TK-6 | $31,540 | $38 | $528 | $32,106 |
| 7-8 | $33,358 | $50 | $630 | $34,038 |
Site Acreage Needs
| Grade | Typical Acres | Average Students | Projected Unhoused Students | Equivalent Sites Needed | Site Acres Needed |
| TK-6 | 10 | 600 | 140 | 0.23 | 2.33 |
| 7-8 | 20 | 800 | 0 | 0.00 | 0.00 |
| TOTAL | 2.33 | ||||
General Site Development Allowance
| Grade | Acres | Allowance/Acre | Base Cost | % Allowance | Added Cost | Total Cost |
| TK-6 | 2.33 | $51,340 | $119,622 | 6% | $269,690 | $389,313 |
| 7-8 | 0.00 | $51,340 | $0 | 6% | $0 | $0 |
| Totals | 2.33 | $389,313 |
Site Acquisition & Development Summary
| Grade | Acres Needed | Land Cost/Acre | Total Land Cost | Site Development Cost/Acre | Site Dev. Cost | General Site Development | Total Site Development |
| TK-6 | 2.33 | $61,474 | $143,234 | $339,346 | $790,676 | $389,313 | $1,179,989 |
| 7-8 | 0.00 | $61,474 | $0 | $319,258 | $0 | $0 | $0 |
| Totals | 2.33 | $143,234 | $790,676 | $389,313 | $1,179,989 |
Impact of Residential Development
This next table compares the development-related enrollment to the available district capacity for each grade level and then multiplies the unhoused students by the new school construction costs to determine the total school facility costs related to the impact of new residential housing developments.
In addition, the State provides that new construction projects can include the costs for site acquisition and development, including appraisals, surveys and title reports. The District needs to acquire 2.33 acres to meet the needs of the students projected from the new developments. Therefore, the costs for site acquisition and development of the land have been included in the total impacts due to new development.
| School Facility | Students Generated | Available Space | Net Unhoused | Construction Cost Per Student | Total Facility Costs |
| Elementary | 140 | 0 | 140 | $32,106 | $4,494,840 |
| Middle | 43 | 418 | 0 | $34,038 | $0 |
| Site Purchase: 2.33 acres | $143,234 | ||||
| Site Development: | $1,179,989 | ||||
| New Construction needs due to development: | $5,818,063 | ||||
| Average cost per student: | $31,793 | ||||
| Total Residential Sq. Ft: | 937,990 | ||||
| Residential Fee Justified: | $6.20 |
Impact of Other Residential Development
In addition to new residential development projects that typically include new single family homes and new multi-family units, the District can also be impacted by additional types of new development projects. These include but are not limited to redevelopment projects, additions to existing housing units, and replacement of existing housing units with new housing units.
These development projects are still residential projects and therefore it is reasonable to assume they would have the same monetary impacts per square foot as the new residential development projects. However, the net impact is reduced due to the fact that there was a previous residential building in its place. Therefore, the development impact fees should only be charged for other residential developments if the new building(s) exceed the square footage area of the previous building(s). If the new building is larger than the existing building, then it is reasonable to assume that additional students could be generated by the project. The project would only pay for the development impact fees for the net increase in assessable space generated by the development project. Education Code allows for an exemption from development impacts fees for any additions to existing residential structures that are 500 square feet or less.
Impact of Commercial/Industrial Development
There is a correlation between the growth of commercial/industrial firms/facilities within a community and the generation of school students within most business service areas. Fees for commercial/industrial can only be imposed if the residential fees will not fully mitigate the cost of providing school facilities to students from new development.
The approach utilized in this section is to apply statutory standards, U.S. Census employment statistics, and local statistics to determine the impact of future commercial/industrial development projects on the District. Many of the factors used in this analysis were taken from the U.S. Census, which remains the most complete and authoritative source of information on the community in addition to the “1990 SanDAG Traffic Generators Report”.
Employees per Square Foot of Commercial Development
Results from a survey published by the San Diego Association of Governments “1990 San DAG Traffic Generators” are used to establish numbers of employees per square foot of building area to be anticipated in new commercial or industrial development projects. The average number of workers per 1,000 square feet of area ranges from 0.06 for Rental Self Storage to 4.79 for Standard Commercial Offices. The generation factors from that report are shown in the following table.
| Commercial/Industrial Category | Average Square Foot Per Employee | Employees Per Average Square Foot |
| Banks | 354 | 0.00283 |
| Community Shopping Centers | 652 | 0.00153 |
| Neighborhood Shopping Centers | 369 | 0.00271 |
| Industrial Business Parks | 284 | 0.00352 |
| Industrial Parks | 742 | 0.00135 |
| Rental Self Storage | 15541 | 0.00006 |
| Scientific Research & Development | 329 | 0.00304 |
| Lodging | 882 | 0.00113 |
| Standard Commercial Office | 209 | 0.00479 |
| Large High Rise Commercial Office | 232 | 0.00431 |
| Corporate Offices | 372 | 0.00269 |
| Medical Offices | 234 | 0.00427 |
Students per Employee
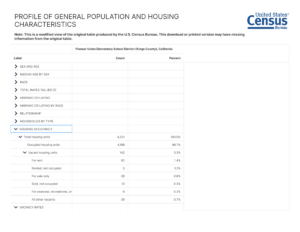
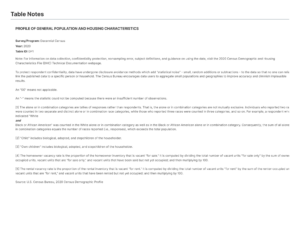
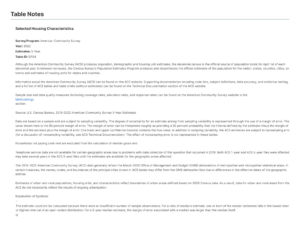
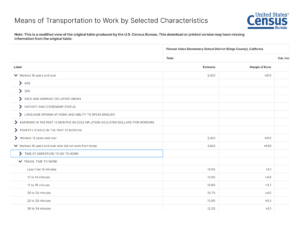
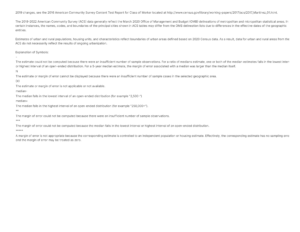
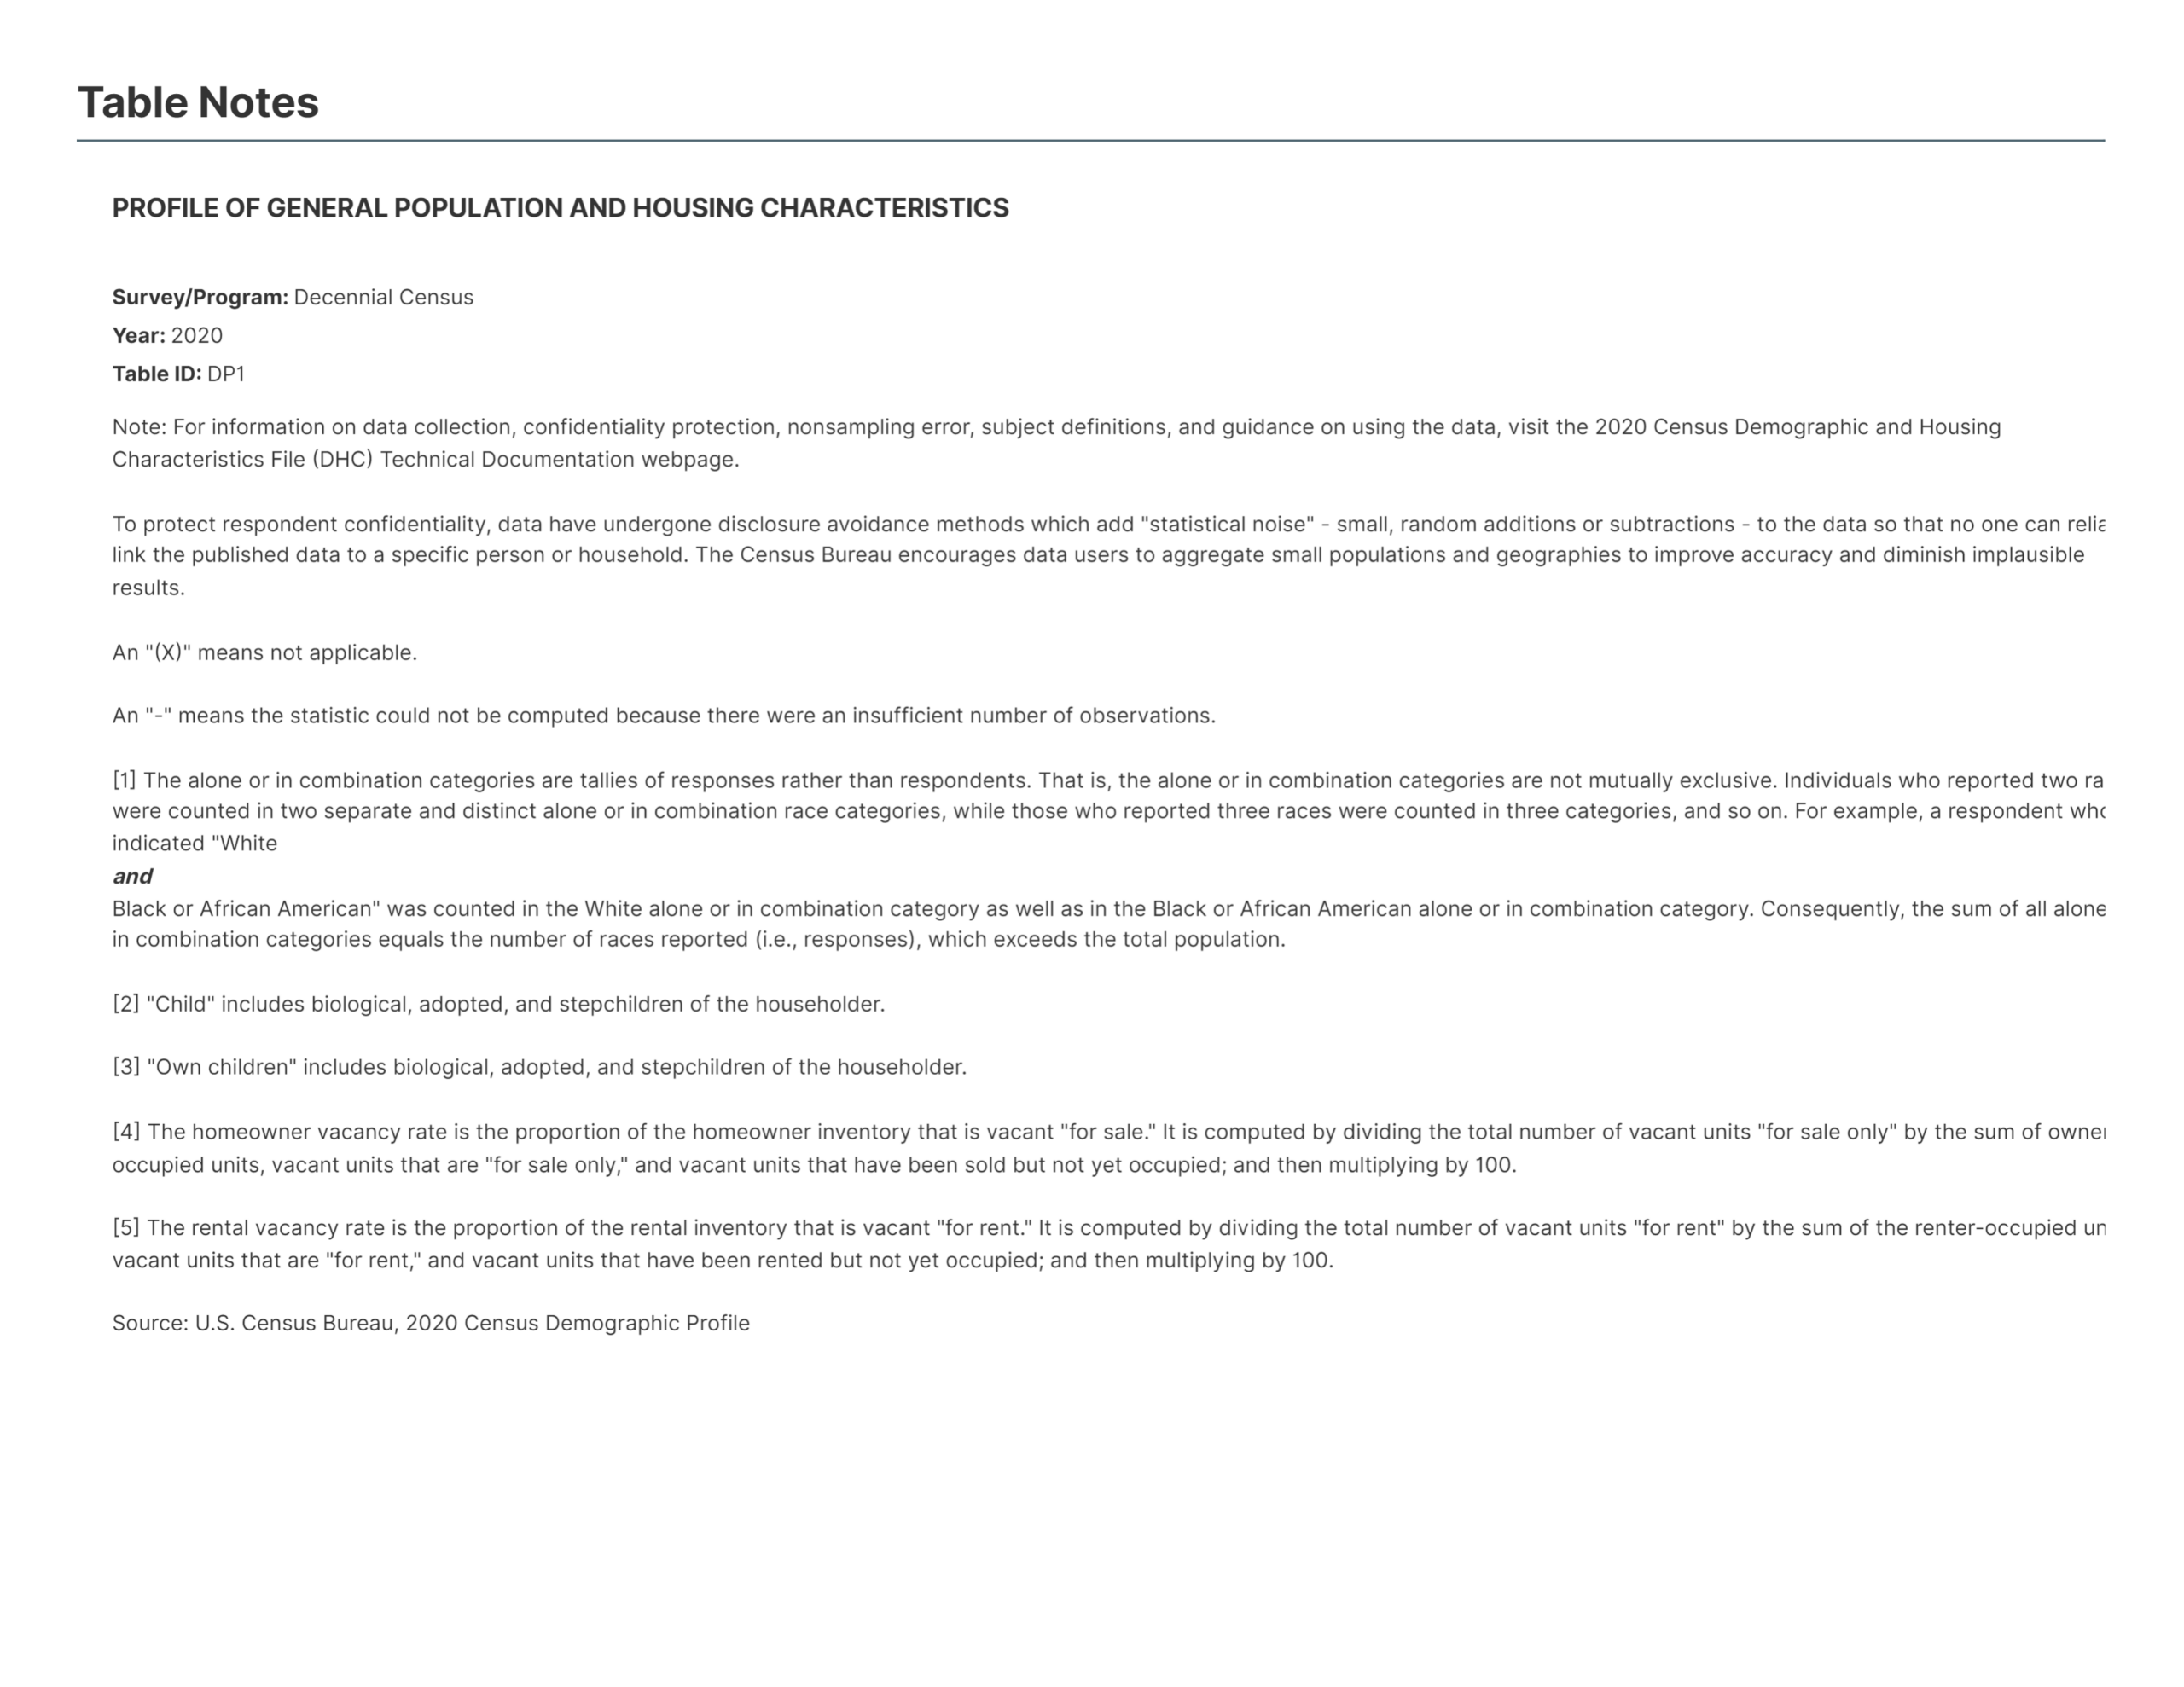
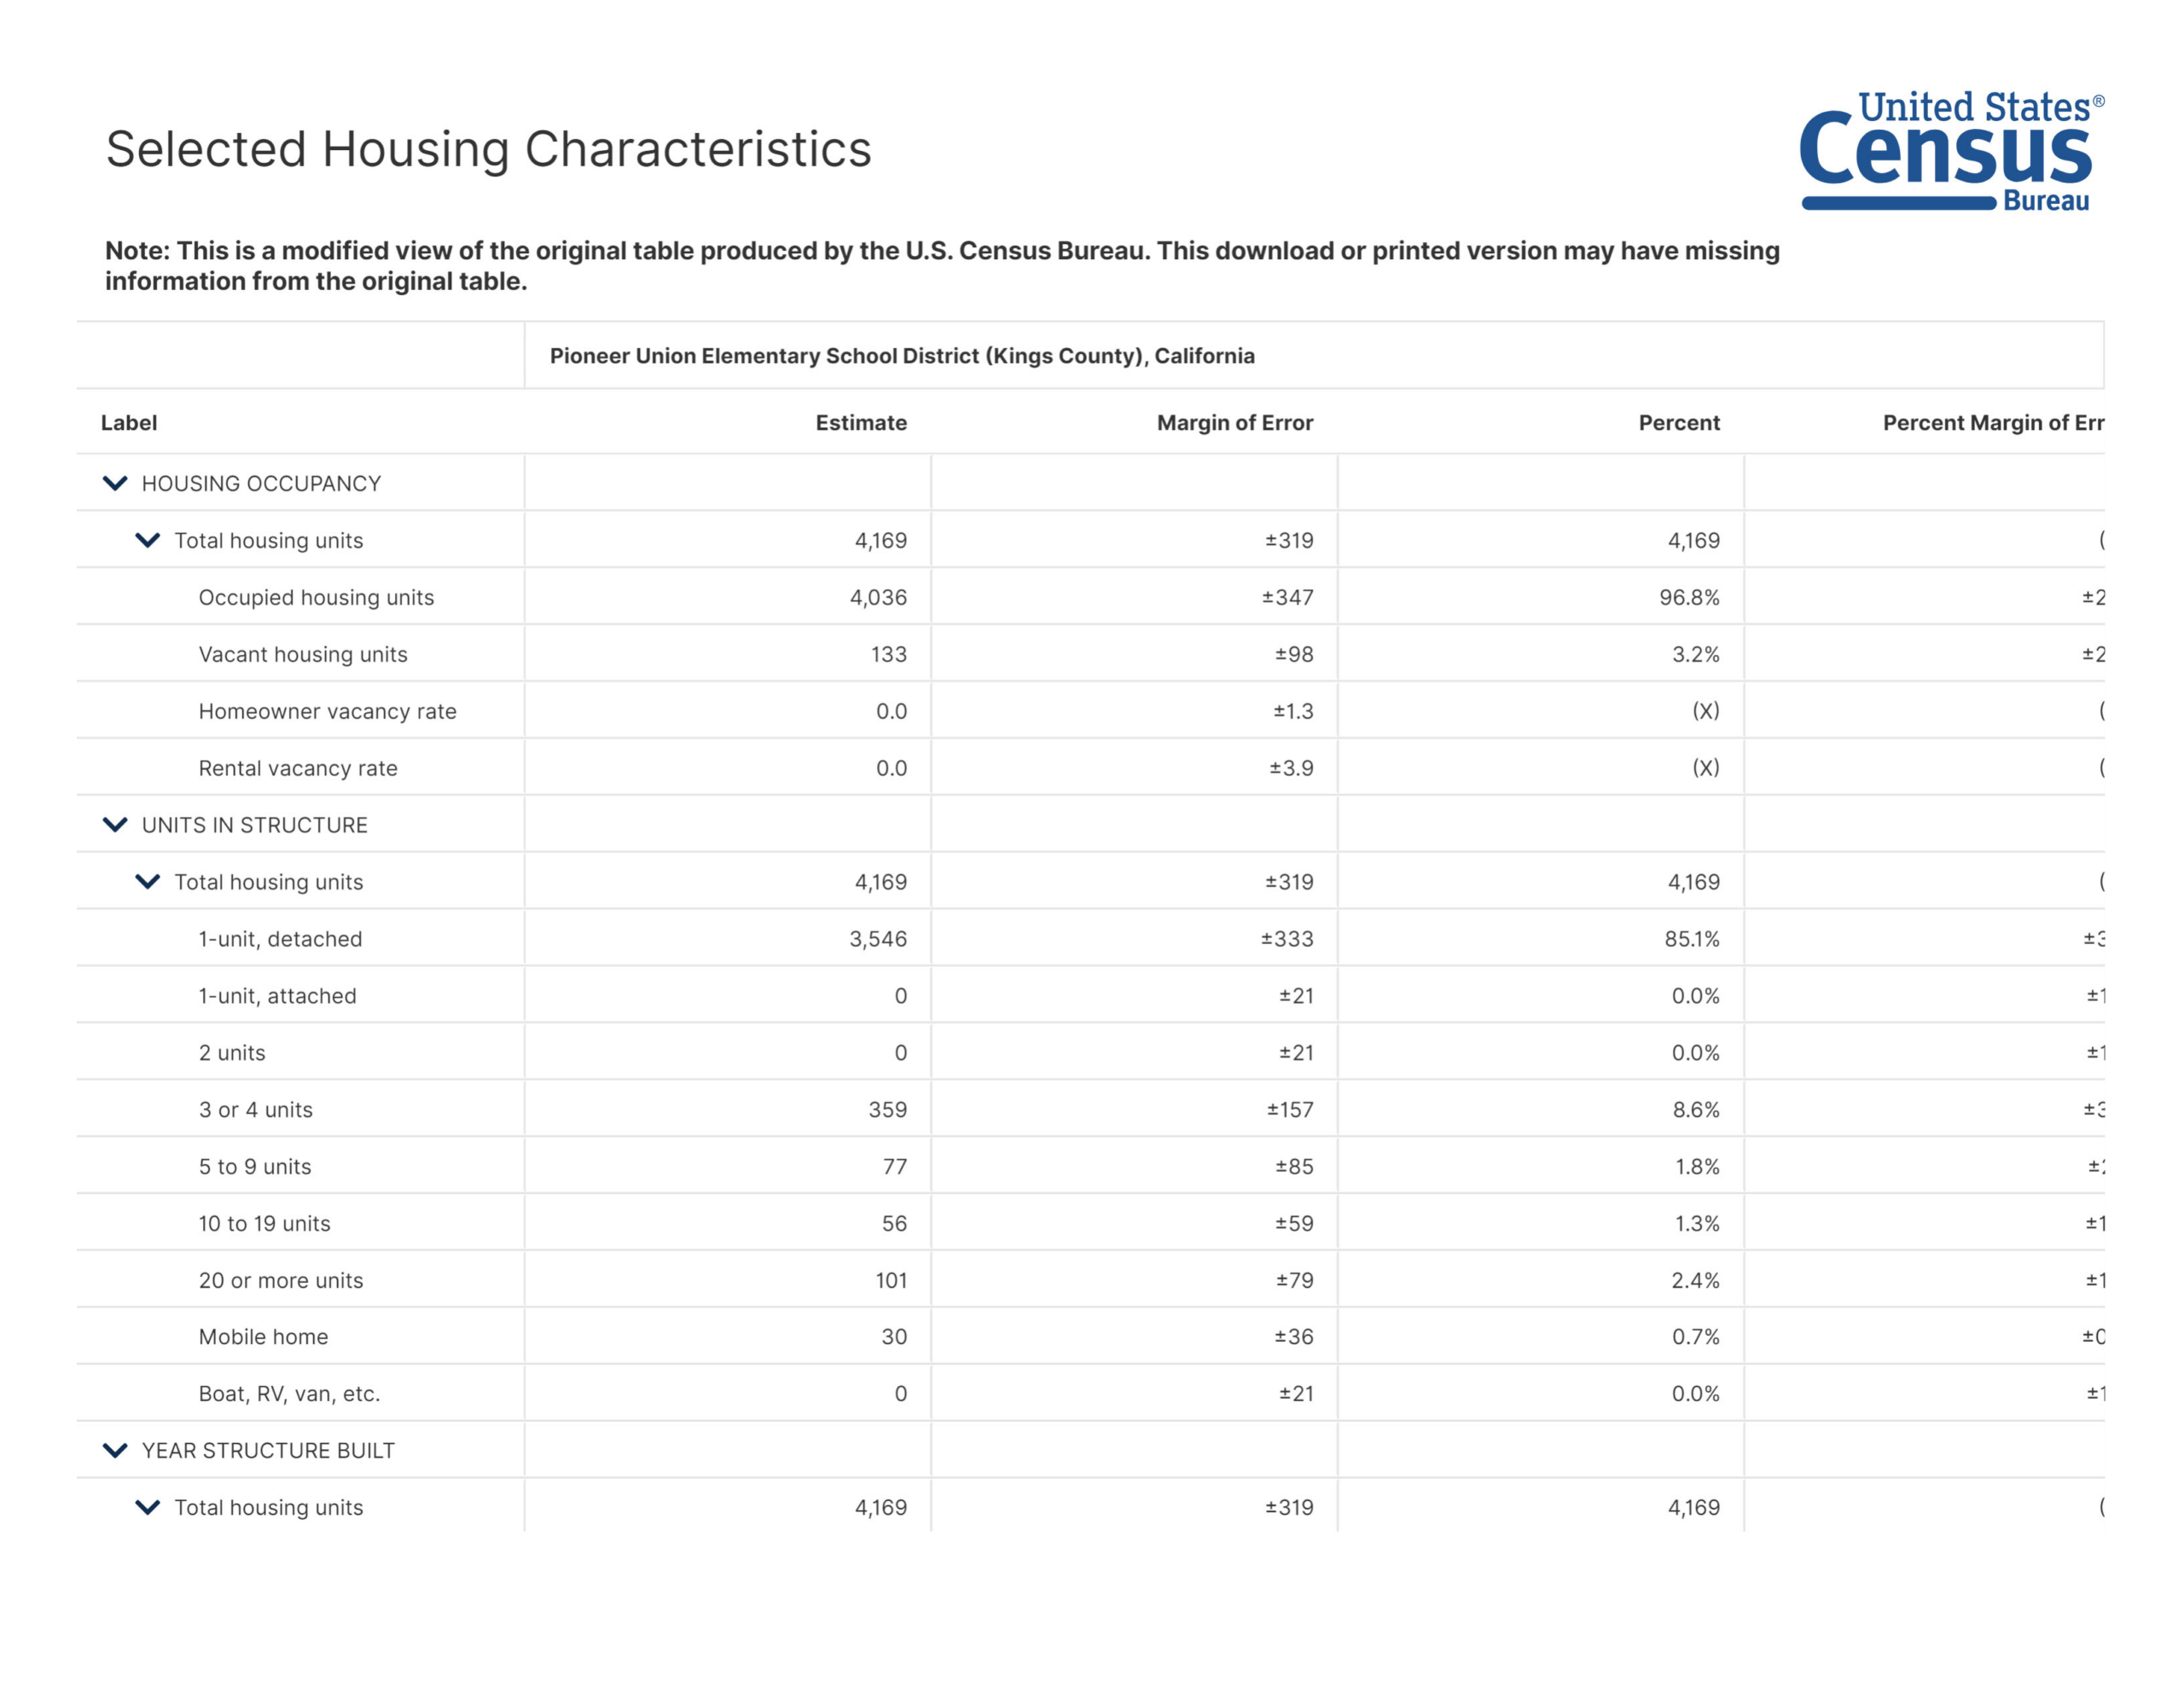
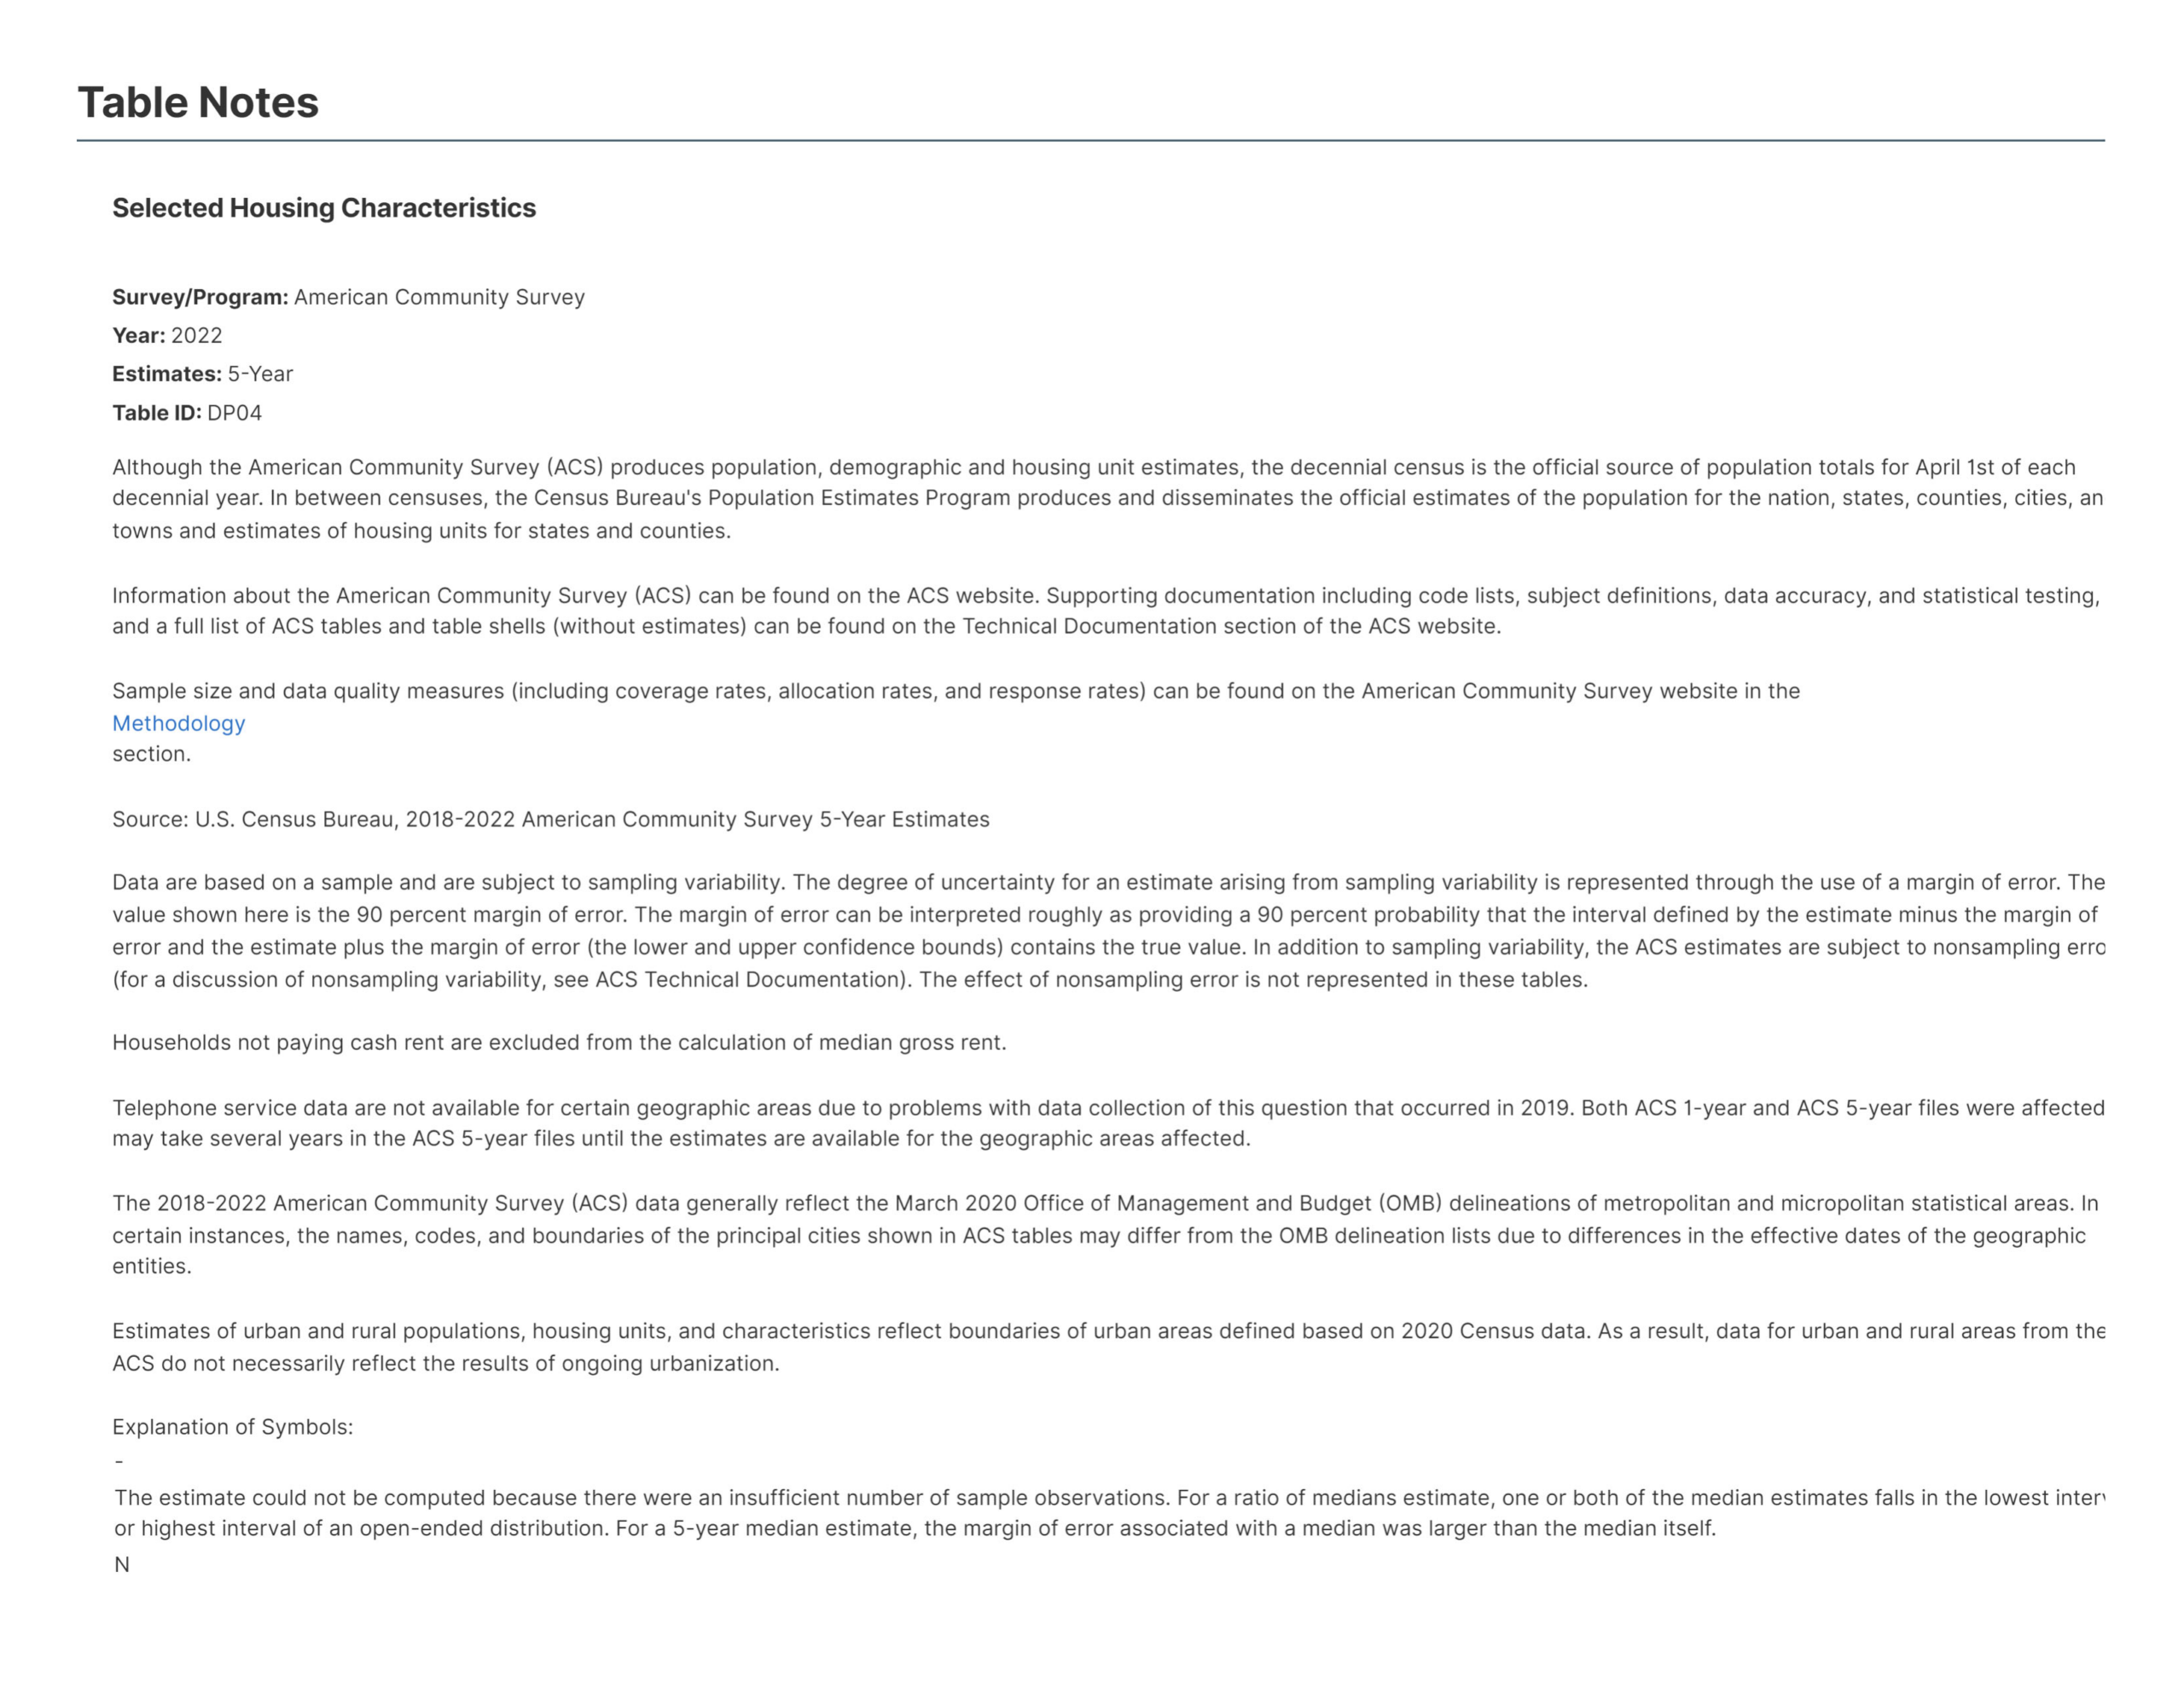
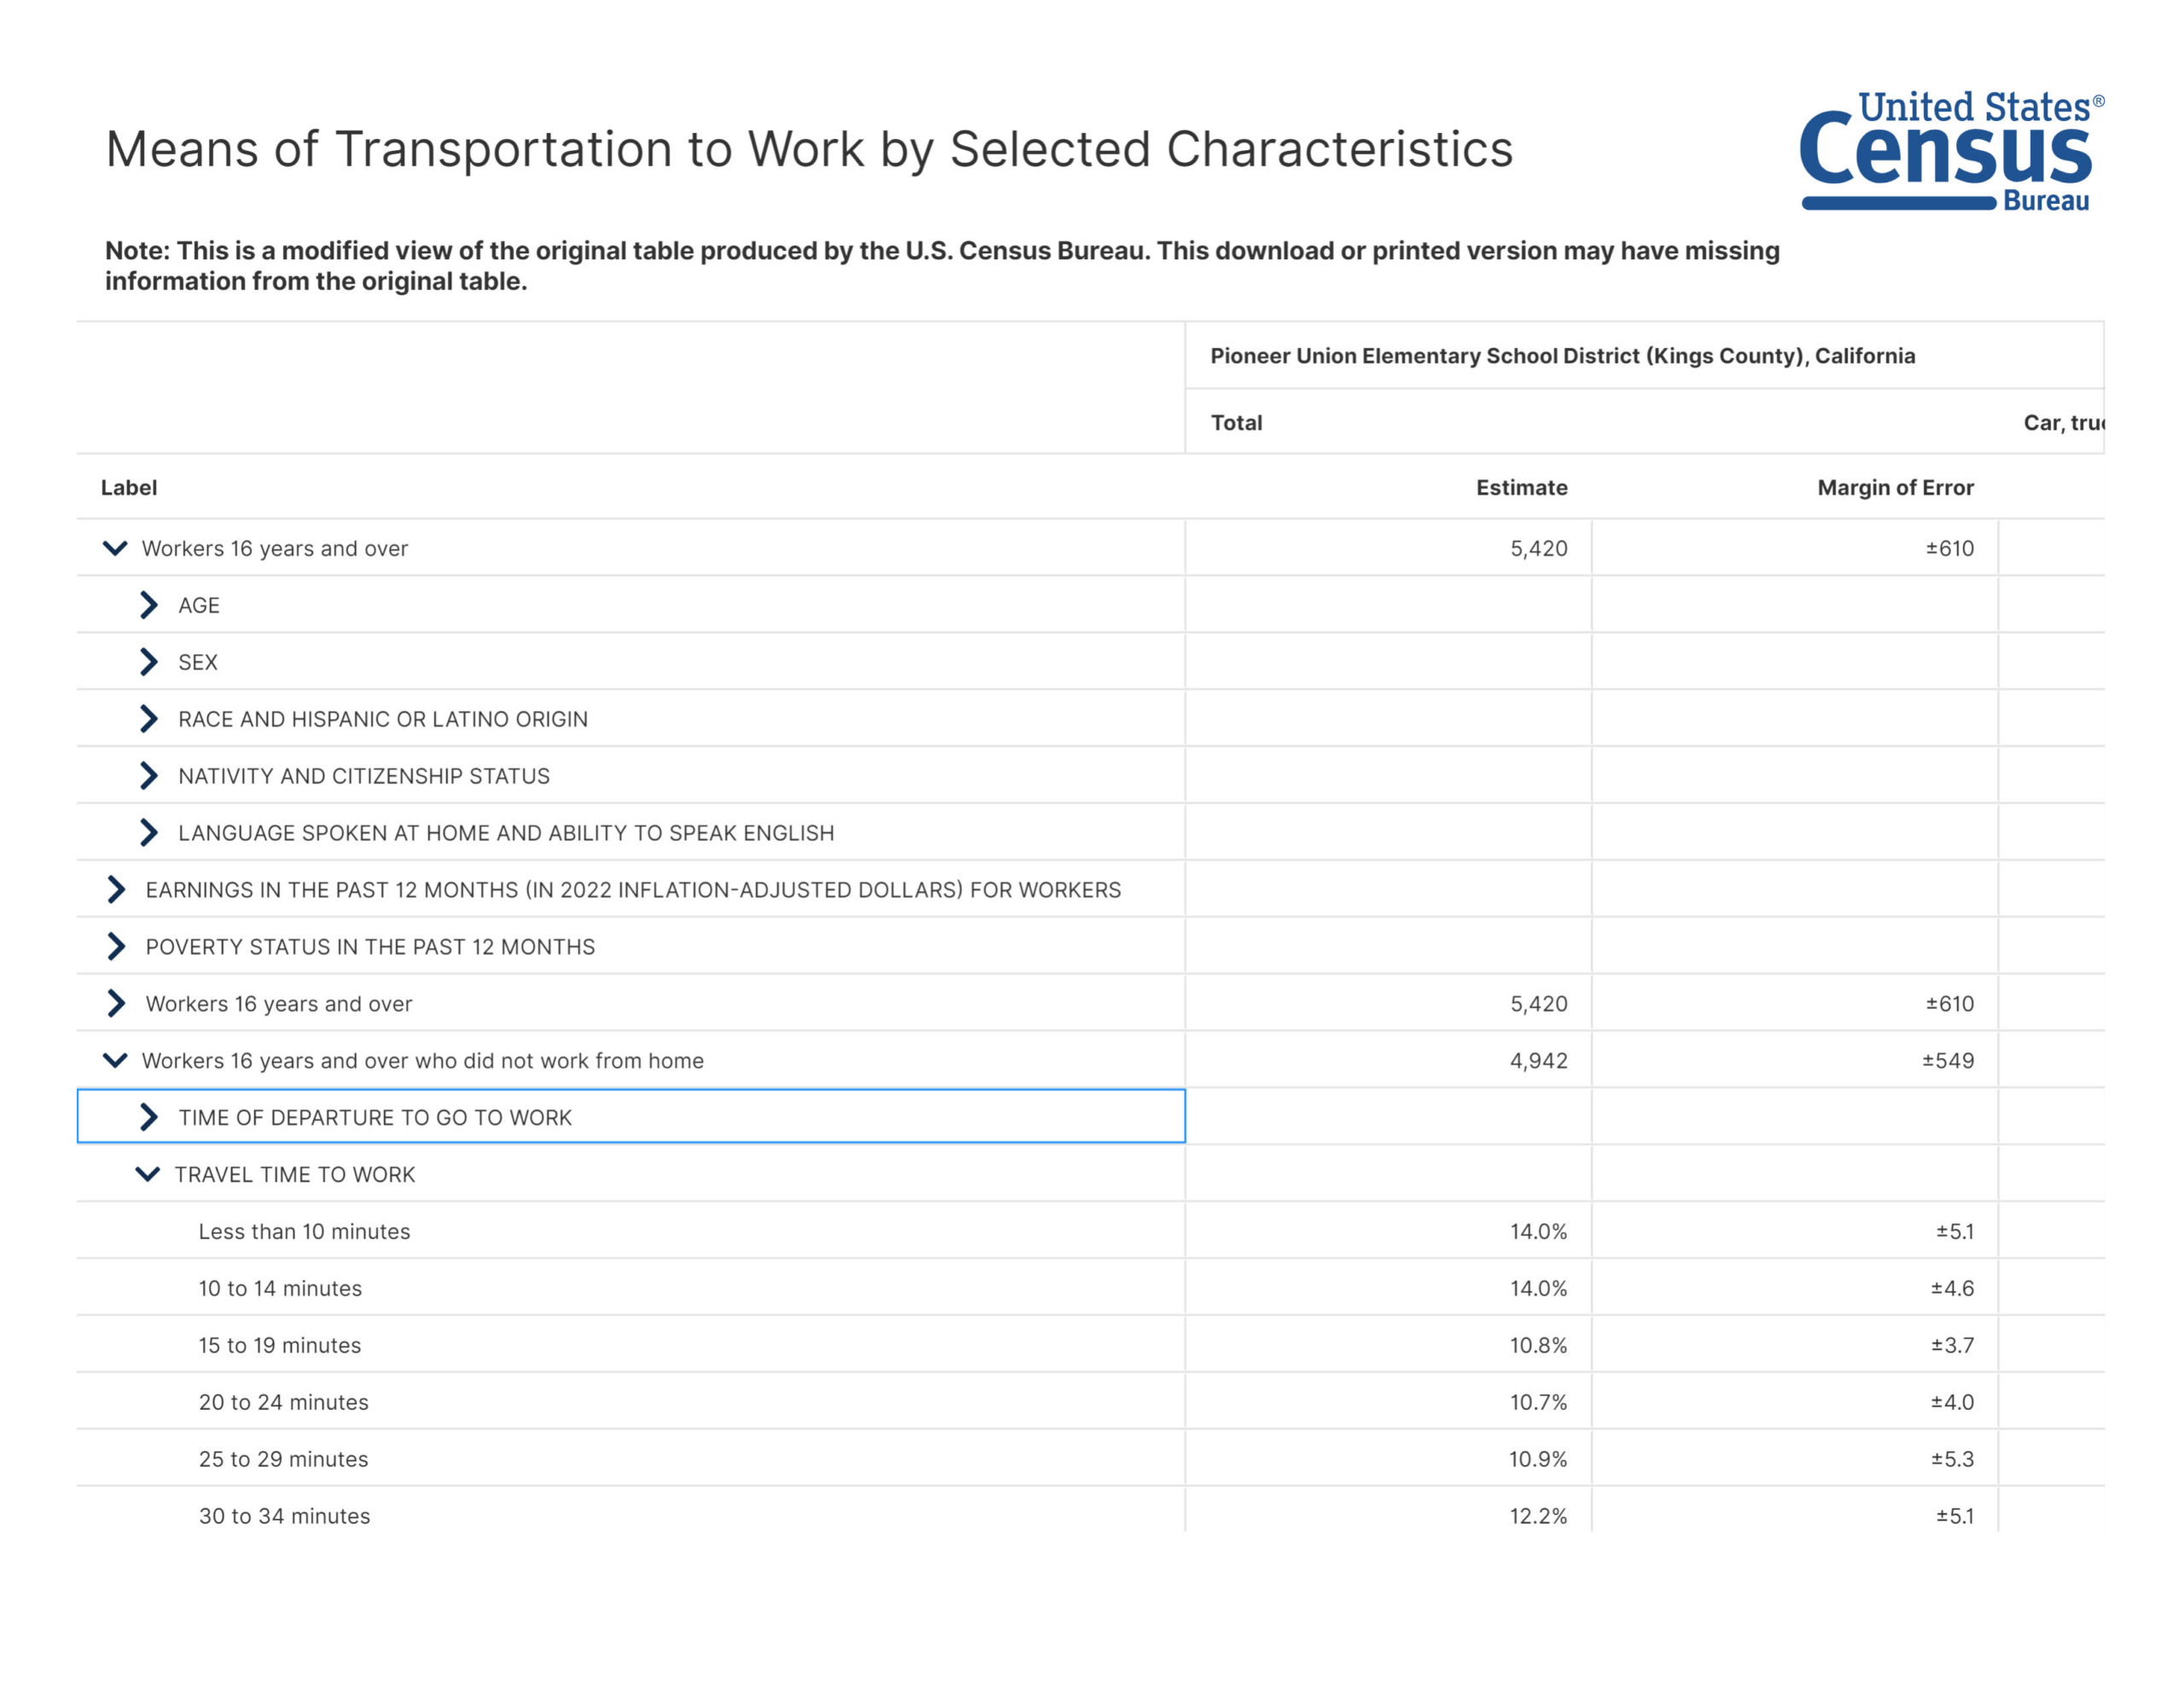
The number of students per employee is determined by using the S0802: Means of Transportation to Work by Selected Characteristics 2018-2022 American Community Survey 5-Year Estimates and DP1: Profile of General Population and Housing Characteristics 2020: DEC Demographic Profile for the District. There were 5,420 employees and 4,189 homes in the District. This represents a ratio of 1.2939 employees per home.
There were 1,578 school age children attending the District in 2020. This is a ratio of 0.2911 students per employee. This ratio, however, must be reduced by including only the percentage of employees that worked in their community of residence (28%), because only those employees living in the District will impact the District’s school facilities with their children. The net ratio of students per employee in the District is 0.0815.
School Facilities Cost per Student
Facility costs for housing commercially generated students are the same as those used for residential construction. The cost factors used to assess the impact from commercial development projects are contained in Table 10.
Residential Offset
When additional employees are generated in the District as a result of new commercial/industrial development, fees will also be charged on the residential units necessary to provide housing for the employees living in the District. To prevent a commercial or industrial development from paying for the portion of the impact that will be covered by the residential fee, this amount has been calculated and deducted from each category. The residential offset amount is calculated by multiplying the following factors together and dividing by 1,000 (to convert from cost per 1,000 square feet to cost per square foot).
- * Employees per 1,000 square feet (varies from a low of 0.06 for rental self storage to a high of 4.79 for office building).
- * Percentage of employees that worked in their community of residence (28 percent).
- * Housing units per employee (0.7729). This was derived from the 2018-2022 ACS 5 Year Estimates and DP1 data for the District, which indicates there were 4,189 housing units and 5,420 employees.
- * Percentage of employees that will occupy new housing units (75 percent).
- * Average square feet per dwelling unit (1,934).
- * Residential fee charged by the District ($3.10 (60% of $5.17 per square foot)).
- * Average cost per student was determined in Table 10.
The following table shows the calculation of the school facility costs generated by a square foot of new commercial/industrial development for each category of development.
Net Cost per Square Foot
| Type | Employees per 1,000 Sq. Ft | Students per Employee | Students per 1,000 Sq. Ft | Average Cost per Student | Cost per Sq. Ft | Residential offset per Sq. Ft | Net Cost per Sq. Ft |
| Banks | 2.83 | 0.0815 | 0.231 | $31,793 | $7.33 | $2.75 | $4.58 |
| Community Shopping Centers | 1.53 | 0.0815 | 0.125 | $31,793 | $3.97 | $1.49 | $2.48 |
| Neighborhood Shopping Centers | 2.71 | 0.0815 | 0.221 | $31,793 | $7.02 | $2.64 | $4.38 |
| Industrial Business Parks | 3.52 | 0.0815 | 0.287 | $31,793 | $9.12 | $3.43 | $5.69 |
| Industrial Parks | 1.35 | 0.0815 | 0.110 | $31,793 | $3.50 | $1.31 | $2.19 |
| Rental Self Storage | 0.06 | 0.0815 | 0.005 | $31,793 | $0.16 | $0.06 | $0.10 |
| Scientific Research & Development | 3.04 | 0.0815 | 0.248 | $31,793 | $7.88 | $2.96 | $4.92 |
| Lodging | 1.13 | 0.0815 | 0.092 | $31,793 | $2.93 | $1.10 | $1.83 |
| Standard Commercial Office | 4.79 | 0.0815 | 0.390 | $31,793 | $12.41 | $4.66 | $7.75 |
| Large High Rise Commercial Office | 4.31 | 0.0815 | 0.351 | $31,793 | $11.17 | $4.19 | $6.98 |
| Corporate Offices | 2.69 | 0.0815 | 0.219 | $31,793 | $6.97 | $2.62 | $4.35 |
| Medical Offices | 4.27 | 0.0815 | 0.348 | $31,793 | $11.07 | $4.16 | $6.91 |
Since the District’s share of the State Maximum Fee is now $.50 (60% of $0.84) for commercial/ industrial construction, the District is justified in collecting the maximum fee for all categories with the exception of Rental Self Storage. The District can only justify collection of $0.10 per square foot of Rental Self Storage construction.
Verifying the Sufficiency of the Development Impact
Education Code Section 17620 requires districts to find that fee revenues will not exceed the cost of providing school facilities to the students generated by the development paying the fees. This section shows that the fee revenues do not exceed the impact of the new development.
The total need for school facilities resulting from new development totals $5,818,063. The amount the District would collect over the five year period at the maximum rate of $3.10 (60% of $5.17) for residential and $0.50 (60% of $0.84) for commercial/industrial development would be as follows:
$3.10 x 485 homes x 1,934 sq ft per home = $2,907,769 for Residential
$0.50 x 8,074 sq ft per year x 5 years = $20,185 for Commercial/Industrial
Total projected 5 year income: $2,927,954
The estimated income is less than the projected facility needs due to the impact of new development projects.
District Map
The following map shows the extent of the areas for which development fees are applicable to the Pioneer Union Elementary School District.

Conclusion
Based on the data contained in this Study, it is found that a reasonable relationship exists between residential, commercial/industrial development and the need for school facilities in the Pioneer Union Elementary School District. The following three nexus tests required to show justification for levying fees have been met:
Burden Nexus: New residential development will generate an average of 0.3767 TK-8 grade students per unit. Because the District does not have adequate facilities for all the students generated by new developments, the District will need to build additional facilities and/or modernize/reconstruct the existing facilities in order to maintain existing level of services in which the new students will be housed.
Cost Nexus: The cost to provide new and reconstructed facilities is an average of $6.20 per square foot of residential development. Each square foot of residential development will generate $3.10 (60% of $5.17) in developer fees resulting in a shortfall of $3.10 per square foot.
Benefit Nexus: The developer fees to be collected by the Pioneer Union Elementary School District will be used for the provision of additional and reconstructed or modernized school facilities. This will benefit the students to be generated by new development by providing them with adequate educational school facilities.
The District’s planned use of the fees received from development impacts will include the following types of projects, each of which will benefit students from new developments.
1) New Schools: When there is enough development activity occurring in a single area, the District will build a new school to house the students from new developments.
2) Additions to Existing Schools: When infill development occurs, the District will accommodate students at existing schools by building needed classrooms and/or support facilities such as cafeterias, restrooms, gyms and libraries as needed to increase the school capacity. Schools may also need upgrades of the technology and tele-communication systems to be able to increase their capacity.
3) Portable Replacement Projects: Some of the District’s capacity is in portables and therefore may not be included in the State’s capacity calculations. These portables can be replaced with new permanent or modular classrooms to provide adequate space for students from new developments. These projects result in an increase to the facility capacity according to State standards. In addition, old portables that have reached the end of their life expectancy, will need to be replaced to maintain the existing level of service. These types of projects are considered modernization projects in the State Building Program. If development impacts did not exist, the old portables could be removed.
4) Modernization/Upgrade Projects: In many cases, students from new developments are not located in areas where new schools are planned to be built. The District plans to modernize or upgrade older schools to be equivalent to new schools so students will be housed in equitable facilities to those students housed in new schools. These projects may include updates to the building structures to meet current building standards, along with upgrades to the current fire and safety standards and any access compliance standards.
The District plans to use the developer fees to make payments on their COP’s. The District is also looking to purchase land for a future school site.
Per the District’s agreement with the High School District, the elementary share of the developer fees collected is 60%. The reasonable relationship identified by these findings provides the required justification for the Pioneer Union Elementary School District to levy the maximum fees of $3.10 (60% of $5.17) per square foot for residential construction and $0.50 (60% of $0.84) per square foot for commercial/industrial construction, except for Rental Self Storage facilities in which a fee of $0.10 per square foot is justified as authorized by Education Code Section 17620.
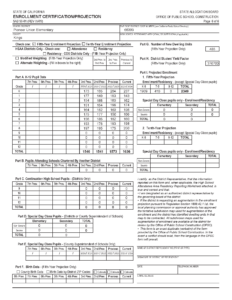
Appendices
Note: To preserve the format of the original document’s appendices, these final pages are presented below as images. A complete PDF of the report is available here: https://www.pioneerunion.org/wp-content/uploads/2026/02/puesd_finance_2024-developer-fee-study_2026-02-12.pdf


